2014 Resource Estimate
On July 24, 2014 the Company announced a significantly expanded and upgraded 43-101 Mineral Resource Estimate for Wellgreen, highlighted by:
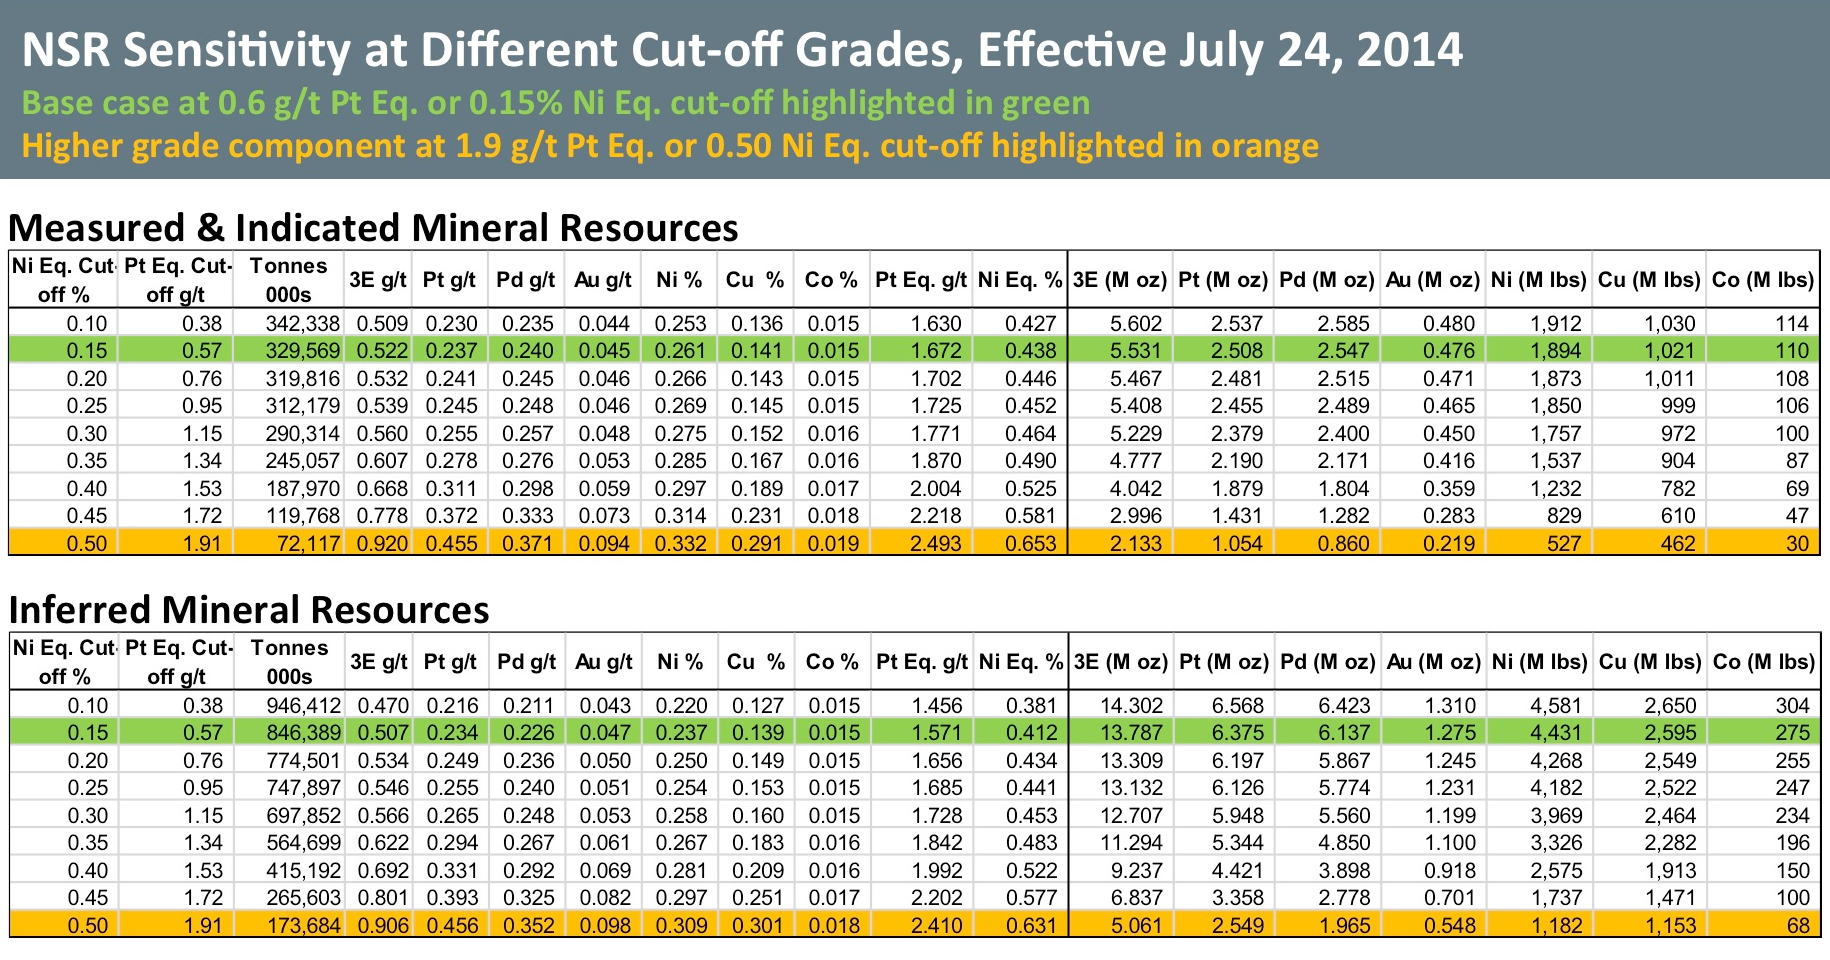
- Measured & Indicated (“M&I”) Mineral Resources increased to 330 million tonnes at 1.67 g/t platinum equivalent (“Pt Eq.”) or 0.44% nickel equivalent (“Ni Eq.”) at a 0.57 g/t Pt Eq. cut-off or 0.15% Ni Eq. cut‐off in a pit constrained resource containing 5.53 million ounces of 3E (platinum +palladium +gold) with 1,894 million pounds of nickel and 1,021 million pounds of copper (See detailed breakdown in tables below).
- Inferred Mineral Resource increased to 846 million tonnes at 1.57 g/t Pt Eq. or 0.41% Ni Eq. at a 0.57 g/t Pt Eq. cut-off or 0.15% Ni Eq. cut‐off in a pit constrained resource containing 13.8 million ounces of 3E (platinum +palladium +gold) with 4,431 million pounds of nickel and 2,595 million pounds of copper.
- Higher Grade Measured & Indicated (“M&I”) Mineral Resource of 72 million tonnes at 2.49 g/t Pt Eq. or 0.65% Ni Eq. at a 1.9 g/t Pt Eq. cut-off or 0.50% Ni Eq. cut‐off containing 2.13 million ounces of 3E (platinum +palladium +gold) with 527 million pounds of nickel and 462 million pounds of copper.
- Higher Grade Inferred Mineral Resource of 174 million tonnes at 2.41 g/t Pt Eq or 0.63% Ni Eq at a 1.9 g/t Pt Eq cut-off or 0.50% Ni Eq. cut‐off containing 5.06 million ounces of 3E (platinum +palladium +gold) with 1,182 million pounds of nickel and 1,153 million pounds copper.
Mineral resource update was prepared in accordance with the guidelines of National Instrument 43-101 by independent Qualified Person Ron Simpson, P.Geo., of GeoSim Services Inc. and John Sagman, P.Eng., Wellgreen Platinum’s Senior VP & COO and a Qualified Person, with an effective date of July 23, 2014.
Wellgreen 2014 Mineral Resource Technical Report
This new mineral resource estimate, together with the updated metallurgical testing results in September, will be incorporated into the 2014 Preliminary Economic Assessment (PEA) for the Wellgreen Project targeted for completion in Q4 2014. The Company is fully-funded through completion of the PEA update and to initiate Pre-feasibility level studies.
|
Mineral Resource Estimate by Category - At a 0.57 g/t Pt Eq. or 0.15% Ni Eq. cut-off (Base Case)
|
||||||||||
|
Category
|
Tonnes
(000s) |
3E
(g/t) |
Pt
(g/t) |
Pd
(g/t) |
Au
(g/t) |
Ni
(%) |
Cu
(%) |
Co
(%) |
Pt Eq.
(g/t) |
Ni Eq.
(%) |
|
Measured
|
92,293
|
0.550
|
0.252
|
0.246
|
0.052
|
0.260
|
0.155
|
0.015
|
1.713
|
0.449
|
|
Indicated
|
237,276
|
0.511
|
0.231
|
0.238
|
0.042
|
0.261
|
0.135
|
0.015
|
1.656
|
0.434
|
|
Total M&I
|
329,569
|
0.522
|
0.237
|
0.240
|
0.045
|
0.261
|
0.141
|
0.015
|
1.672
|
0.438
|
|
Inferred
|
846,389
|
0.507
|
0.234
|
0.226
|
0.047
|
0.237
|
0.139
|
0.015
|
1.571
|
0.412
|
|
Contained Metals by Category - At a 0.57 g/t Pt Eq. or 0.15% Ni Eq. cut-off (Base Case)
|
||||
|
Metal
|
Measured
Resource |
Indicated
Resource |
Total M&I
Resource |
Inferred
Resource |
|
Platinum (000oz)
|
748
|
1,760
|
2,508
|
6,375
|
|
Palladium (000 oz)
|
730
|
1,817
|
2,547
|
6,137
|
|
Gold (000 oz)
|
154
|
322
|
476
|
1,275
|
|
Total 3E (000 oz)
|
1,631
|
3,900
|
5,531
|
13,787
|
|
Nickel (M lbs)
|
528
|
1,366
|
1,894
|
4,431
|
|
Copper (M lbs)
|
315
|
706
|
1,021
|
2,595
|
|
Cobalt (M lbs)
|
31
|
79
|
110
|
275
|
|
Mineral Resource Estimate by Category - At a 1.9 g/t Pt Eq. or 0.50% Ni Eq. cut-off
|
||||||||||
|
Category
|
Tonnes
(000s) |
3E
(g/t) |
Pt
(g/t) |
Pd
(g/t) |
Au
(g/t) |
Ni
(%) |
Cu
(%) |
Co
(%) |
Pt Eq.
(g/t) |
Ni Eq.
(%) |
|
Measured
|
21,854
|
0.923
|
0.454
|
0.366
|
0.103
|
0.326
|
0.301
|
0.019
|
2.492
|
0.653
|
|
Indicated
|
50,264
|
0.919
|
0.455
|
0.373
|
0.090
|
0.334
|
0.286
|
0.019
|
2.493
|
0.653
|
|
Total M&I
|
72,117
|
0.920
|
0.455
|
0.371
|
0.094
|
0.332
|
0.291
|
0.019
|
2.493
|
0.653
|
|
Inferred
|
173,684
|
0.906
|
0.456
|
0.352
|
0.098
|
0.309
|
0.301
|
0.018
|
2.410
|
0.631
|
|
Contained Metals by Category - At a 1.9 g/t Pt Eq. or 0.50% Ni Eq. cut-off
|
||||
|
Metal
|
Measured
Resource |
Indicated
Resource |
Total M&I
Resource |
Inferred
Resource |
|
Platinum (000oz)
|
319
|
736
|
1,054
|
2,549
|
|
Palladium (000 oz)
|
257
|
603
|
860
|
1,965
|
|
Gold (000 oz)
|
73
|
146
|
219
|
548
|
|
Total 3E (000 oz)
|
648
|
1,484
|
2,133
|
5,061
|
|
Nickel (M lbs)
|
157
|
370
|
527
|
1,182
|
|
Copper (M lbs)
|
145
|
317
|
462
|
1,153
|
|
Cobalt (M lbs)
|
9
|
21
|
30
|
68
|
Notes:
- Measured Resources used 50 metre drill spacing. Indicated Resources used 50 metre drill spacing for massive sulphide and gabbro domains, and 100 metre drill spacing for clinopyroxenite and peridotite domains.
- Nickel equivalent (Ni Eq. %) and platinum equivalent (Pt Eq. g/t) calculations reflect total gross metal content using US$ of $8.35/lb Ni, $3.00/lb Cu, $13.00/lb Co, $1,500/oz Pt, $750/oz Pd and $1,250/oz Au and have not been adjusted to reflect metallurgical recoveries.
- Pit constrained grade shells were determined using the following assumptions: metal prices in Note 2 above ; a 45 degree pit slope; assumed metallurgical recoveries of 70% for Ni, 90% for Cu, 64% for Co, 60% for Pt, 70% for Pd and 75% for Au; an exchange rate of USD$1.00=CAD$0.91; and mining costs of $2.00 per tonne, processing costs of $12.91 per tonne, and general & administrative charges of $1.10 per tonne (all expressed in Canadian dollars).
- Totals may not add due to rounding.
- Mineral Resources are not Mineral Reserves and do not have demonstrated economic viability.
July 2014 Updated Cross Sections
Quality Assurance and Quality Control: The technical information disclosed herein with respect to the Wellgreen geologic model and mineral resource update was prepared under the supervision of John Sagman, P.Eng., Wellgreen Platinum’s Senior Vice President and Chief Operating Officer, and Mr. Ron Simpson, P.Geo., of GeoSim Services Inc., each of whom is a “Qualified Person” as defined in NI 43-101. Investors should refer to the July 24, 2014 technical report for the Wellgreen project. In addition, Mr. Sagman has reviewed and approved the technical information contained on this website.